North Carolina Power Reserves Study Shows Solar Contribution Offsets Over 3 Million Tons of CO2 Per Year
 Solar generation in the Duke Energy Progress region (referred to as the CPLE Balancing Authority) of North Carolina offset over 3 million tons of carbon dioxide (CO2) in 2021, according to a new study from the NC Clean Energy Technology Center (NCCETC) at NC State University. NCCETC collaborated with the NC Department of Environmental Quality for the North Carolina Power Reserves Project – an analysis of utility operating reserves required to balance increasing quantities of solar photovoltaic (PV) generation being added to Duke Energy’s power grid.
“This study had multiple, interrelated objectives pertaining to how increased levels of solar PV generation on the grid is impacting the operation of traditional fossil fuel-fired generating resources,” said Art Samberg, a supporting staff member on the project team and Program Director for NCCETC’s Clean Power & Industrial Efficiency program.
The project aimed to better understand the current needs for operating reserves associated with the intersection of energy demand and increased levels of solar PV grid integration, and to identify and evaluate feasible technology alternatives for power reserve requirements as the solar PV capacity in the state grows to meet demands for clean electricity.
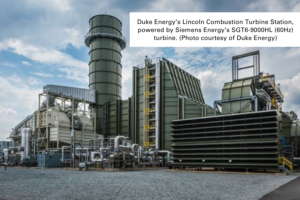 There are multiple operating reserve technologies that utilities can deploy to balance the supply and demand on the electric grid. The two primary generating configurations used are combined cycle and simple cycle gas turbine plants. Combined cycle plants utilize the hot exhaust gasses from the gas turbines to generate additional steam and thus electricity, usually without requiring extra fuel. The extra generating cycle substantially increases the operating efficiency of combined cycle units. Simple cycle plants may utilize the same generating prime mover (i.e. gas turbine) but do not include the extra generation cycle. As such, these units are less efficient and are typically deployed intermittently to meet spikes in electric demand, and are thus frequently referred to as peaking plants. Due to their higher overall efficiency, combined cycle plants have lower pollutant emission rates per kilowatt-hour (kWh) of generation when compared to simple cycle units. Coal plant generating output can also be ramped up and down to meet regional demand, though these units are designed more to be operated as a base load generating asset. Additionally, emissions of CO2 from coal-fired generation is about 50 percent greater compared to natural gas-fired generation.
 Solar generating capacity is on the rise within the CPLE Balancing Authority. In 2018 there was 1,514 megawatts (MW) of solar PV generating capacity within the CPLE region. The amount of solar generating capacity increased by 277 MW between 2018 and 2019 and by another 153 MW between 2019 and 2020. According to Samberg, “From 2018 to 2020, solar generating capacity in CPLE increased by approximately 28 percent to just under 15 percent of total generating capacity in the region.”
The data used for NCCETC’s study covers three years; 2019, 2020 and 2021. “To help focus the data while acknowledging the seasonal variation with regard to the time and magnitude of peak energy demand periods, we selected four months to represent each of the four seasons,” explained Samberg. January data was used to represent winter, April data was used to represent the spring, July was used to represent summer and October represented autumn.
“We found that the time of day of peak electric demand has a big impact on the contribution of solar generation to meeting the peak demand,” Samberg said. Winter peak demand is distributed over both the early morning and evening hours while summer and shoulder (spring/autumn) months exhibit peak demand during a more defined time of the day. Samberg noted, “Due to the timing of the two winter peaks, solar contributes less than 1% to the corresponding peak demand hour.”
 The data from the shoulder months also shows the peak demand most frequently occurs in the late evening after sunset, resulting in a negligible contribution from solar during this time. That being said, when the sun is shining, solar’s contribution toward meeting aggregate demand is noticeable and considerable. This brings into the discussion the need to consider deploying additional battery storage resources to increase the availability of solar energy to those peak demand periods outside normal daytime hours or when solar insolation is low due to weather conditions.
Summertime peak demand periods coincide with the time of day when solar insolation levels (or the exposure to solar energy at a given location) are high, thus elevating the importance of solar generation as part of the energy mix during these high-demand periods. “Over the three-year study period, about two-thirds of July peaks were between 2 and 4 PM with solar contributing 10 to 15 percent to the peak demand,” said Samberg.
Figure 1 shows the electric demand (black line), by hour for each of the four months studied in this analysis. The dual winter peak is evident in the January plot and the noticeable late afternoon summer peak can be seen in the July plot. The shoulder months depict a less cyclic pattern though the peak demand is consistently in the evening hours. It should be pointed out that although solar generation may not contribute significantly to typical early morning winter peaks or evening spring and autumn peak electric demand periods, the overall contribution to the generating mix over the course of the day, as shown in Figure 1, should not be underestimated. For example, during spring and fall afternoons, there is more solar on the grid (orange stacked plot) than combined cycle (CCT) generation (green plot) with both periods exhibiting little need for peaking plant operation. Also, during winter afternoons, the availability of solar on the grid results in very low coal plant generation and virtually no simple cycle (SC) generation (gray plot). 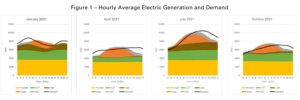
Solar Generation Response to Meet Demand in the CPLE Balancing Authority
The study also analyzed the contribution of solar generation to meeting aggregate demand over defined hours of the day. As Samberg explained, “Aggregating the data gave us a better picture of how solar generation compares with demand over a several hour (block) period instead of just one hour.”
Three distinct block periods of five hours each were plotted between 7 AM and 10 PM in this study to represent the morning, afternoon and evening hours. “For winter, as an example, analyzing demand and generation data over a five hour period provides a better sense of how solar contributes to overall morning demand since it includes the later hours of the morning when solar generation rapidly ramps up,” Samberg said.
 Similar to what is shown in Figure 1, solar generation significantly contributes to aggregate afternoon demand during all four seasons.. The data also revealed solar generation substantially supports aggregate electric demand during the average winter afternoon despite lower insolation (due to the lower sun angle during winter months). Further evaluation attributes this to the fact that winter afternoons with strong solar insolation tend to have lower aggregate demand.
January, for example, contributed an average of 18.3 percent toward the total aggregate afternoon demand over the three year period. During July, the same analysis shows that solar contributed an average of 16.6 percent of aggregate demand. Samberg explained that while the lower summertime afternoon contribution appears counterintuitive, it is the result of the much higher electric demand during summer afternoons. Thus, the 16.6 percent summer afternoon contribution is actually associated with a higher average aggregate generation rate than the 18.3 percent contribution during the analogous period in January.
Of the four seasonal periods, solar contributed most to the aggregate afternoon demand during shoulder months, averaging 31.1 percent for April and 22 percent in October. This higher percentage of contribution toward total demand is caused by the relatively low demand during shoulder month afternoons (as shown in Figure 1).
Avoided CO2 and NOx Emissions Due to Solar Generation
As discussed in this report, solar generation in the CPLE Balancing Authority has reduced the need for fossil generating assets to meet overall demand, and peak aggregate demand. As an example, over the entire three year period (every hour of every day for all three years), approximately 2.6 times as much solar generation was put on the grid than simple cycle generation.
Additional findings from the data revealed that compared to the winter and summer months, the more consistent and relatively low peak electric demand of the shoulder months results in little to no coal plant operation during April and October. Some of this may be explained by the solar energy resources that are available to meet demand for much of the day.
A combination of relatively lower demand and strong insolation results in approximately two-thirds of winter afternoon demand being met by combined cycle gas plants plus solar, Samberg said. He added that solar appears to negate the need for simple cycle plant operation most afternoons (as previously discussed and depicted in Figure 1) but residual demand during winter morning and evenings is met by simple cycle units. As solar generation ramps-up quickly after 9 AM, however, simple cycle generation disappears.
Project findings also provided insight into the value of solar to reduce emissions. According to Samberg, NOx was selected due to it being a precursor pollutant to formation of ground-level oxidants, particularly on hot, sunny days. “The solar generation on the grid during 2019, 2020 and 2021 offset a 3-year average of 1,250 tons per year of NOx and over 2.8 million tons per year of CO2,” Samberg said.
As solar capacity increases, North Carolina will continue to see an increase in avoided emissions from the availability of solar generation. From 2019 to 2021, total avoided annual NOx emissions increased from 1,155 tons to 1,240 tons and avoided annual CO2 emissions rose from 2,614,611 tons to 3,006,091 tons.